🌍 African Countries by GDP per Capita, end Q2 2024
*by GDP per Capita, in USD:
1. 🇸🇨 Seychelles $21,875.08
2. 🇲🇺 Mauritius $12,973.30
3. 🇬🇦 Gabon $9,307.88
4. 🇧🇼 Botswana $7,875.31
5. 🇱🇾 Libya $6,975.33
6. 🇬🇶 Equatorial Guinea $6,733.33
7. 🇿🇦 South Africa $5,974.91
8. 🇩🇿 Algeria $5,721.68
9. 🇳🇦 Namibia $4,745.26
10. 🇨🇻 Cabo Verde $4,655.65
11. 🇹🇳 Tunisia $4,435.00
12. 🇸🇿 Eswatini $4,323.96
13. 🇩🇯 Djibouti $4,183.97
14. 🇲🇦 Morocco $4,077.53
15. 🇪🇬 Egypt $3,224.87
16. 🇸🇹 São Tomé and Príncipe $3,167.30
17. 🇨🇮 Côte d’Ivoire $2,717.40
18. 🇨🇬 Congo, Republic of $2,456.87
19. 🇦🇴 Angola $2,431.58
20. 🇲🇷 Mauritania $2,346.95
21. 🇬🇭 Ghana $2,229.90
22. 🇿🇼 Zimbabwe $2,087.61
23. 🇰🇪 Kenya $1,983.10
24. 🇪🇹 Ethiopia $1,909.98
25. 🇸🇳 Senegal $1,899.73
26. 🇨🇲 Cameroon $1,814.94
27. 🇬🇳 Guinea $1,650.56
28. 🇧🇯 Benin $1,512.24
29. 🇿🇲 Zambia $1,413.42
30. 🇰🇲 Comoros $1,384.49
31. 🇹🇿 Tanzania $1,220.36
32. 🇺🇬 Uganda $1,201.97
33. 🇳🇬 Nigeria $1,109.90
34. 🇱🇸 Lesotho $1,107.08
35. 🇬🇼 Guinea-Bissau $1,087.49
36. 🇹🇬 Togo $1,058.32
37. 🇹🇩 Chad $1,014.08
38. 🇬🇲 Gambia, The $989.17
39. 🇷🇼 Rwanda $988.74
40. 🇧🇫 Burkina Faso $910.21
41. 🇲🇱 Mali $898.82
42. 🇱🇷 Liberia $854.85
43. 🇸🇴 Somalia $775.94
44. 🇨🇩 Congo (DRC) $714.76
45. 🇳🇪 Niger $670.10
46. 🇲🇿 Mozambique $659.10
47. 🇸🇩 Sudan $546.71
48. 🇲🇬 Madagascar $538.18
49. 🇨🇫 Central African Republic $537.60
50. 🇸🇱 Sierra Leone $526.59
51. 🇲🇼 Malawi $480.73
52. 🇸🇸 South Sudan, Republic of $421.86
53. 🇧🇮 Burundi $230.04
*Gross domestic product (GDP) per capita is a country's economic output per person, calculated by dividing a country's GDP by it's population
The average GDP per capita across African countries stands at $2,955, falling short on the global average of $13,840
(IMF/Visual Capitalist)


World Index
Inflation rate:
🇦🇷 Argentina: 209%
🇸🇾 Syria: 120%
🇹🇷 Türkiye: 48.58%
🇱🇧 Lebanon: 32.9%
🇳🇬 Nigeria: 32.7%
🇮🇷 Iran: 31.2%
🇪🇬 Egypt: 26.5%
🇻🇪 Venezuela: 25.75%
🇧🇩 Bangladesh: 9.92%
🇺🇦 Ukraine: 9.7%
🇷🇺 Russia: 8.6%
🇰🇿 Kazakhstan: 8.5%
🇵🇰 Pakistan: 7.2%
🇮🇳 India: 5.49%
🇵🇱 Poland: 5.0%
🇧🇷 Brazil: 4.76%
🇲🇽 Mexico: 4.76%
🇿🇦 South Africa: 3.8%
🇳🇱 Netherlands: 3.6%
🇭🇺 Hungary: 3.0%
🇳🇴 Norway: 3.0%
🇦🇺 Australia: 2.8%
🇨🇿 Czechia: 2.6%
🇯🇵 Japan: 2.5%
🇦🇪 UAE: 2.5%
🇺🇸 USA: 2.4%
🇩🇪 Germany: 2.0%
🇦🇹 Austria: 1.8%
🇪🇸 Spain: 1.8%
🇮🇩 Indonesia: 1.71%
🇸🇦 Saudi Arabia: 1.7%
🇬🇧 UK: 1.7%
🇨🇦 Canada: 1.6%
🇸🇪 Sweden: 1.6%
🇰🇷 South Korea: 1.3%
🇫🇷 France: 1.2%
🇮🇹 Italy: 0.9%
🇮🇪 Ireland: 0.7%
🇨🇳 China: 0.3%
📉 Ranked: The Most Dangerous Jobs in the United States
Some jobs inherently carry significant risks due to hazardous working conditions, exposure to harmful substances, and the physical demands of the tasks. Unfortunately, these work injuries can sometimes be fatal. The U.S. Bureau of Labor Statistics recorded 5,486 fatal work injuries in 2022, marking a 5.7% increase from 2021. This means a worker died every 96 minutes from a work-related injury that year.
The Most Dangerous Jobs in 2022
Here are the six occupations with the highest rates of fatal work injuries per 100,000 full-time workers, along with their number of fatal work injuries in 2022:
1. Logging Workers
* Fatal Work Injury Rate: 100.7 per 100,000 workers
* Number of Fatal Work Injuries: 54
2.Roofers
* Fatal Work Injury Rate: 57.5 per 100,000 workers
* Number of Fatal Work Injuries: 105
3. Fishing and Hunting Workers
* Fatal Work Injury Rate: 50.9 per 100,000 workers
* Number of Fatal Work Injuries: 16
4. Helpers, Construction Trades
* Fatal Work Injury Rate: 38.5 per 100,000 workers
* Number of Fatal Work Injuries: 20
5. Aircraft Pilots and Flight Engineers
* Fatal Work Injury Rate: 35.9 per 100,000 workers
* Number of Fatal Work Injuries: 72
6. Driver/Sales Workers and Truck Drivers
* Fatal Work Injury Rate: 30.4 per 100,000 workers
* Number of Fatal Work Injuries: 1,115
Key Insights
Logging Workers: Logging remains an extremely hazardous occupation with the highest fatal work injury rate.
Truck Drivers: Despite a lower injury rate, truck drivers had the most fatalities (1,115) due to the dangerous nature of operating large vehicles for long hours in remote areas.
Transportation Incidents: These were the most frequent type of fatal event, accounting for 38% of all occupational fatalities. In 2022, there were 2,066 fatal injuries from transportation incidents, a 4.2% increase from 2021.
Understanding the risks associated with these jobs can help in formulating better safety protocols and preventive measures to protect workers.
#dangerousjobs #workplacesafety #occupationalhazards #uslaborstatistics #workinjuries #safetyfirst #laborstatistics #jobsafety
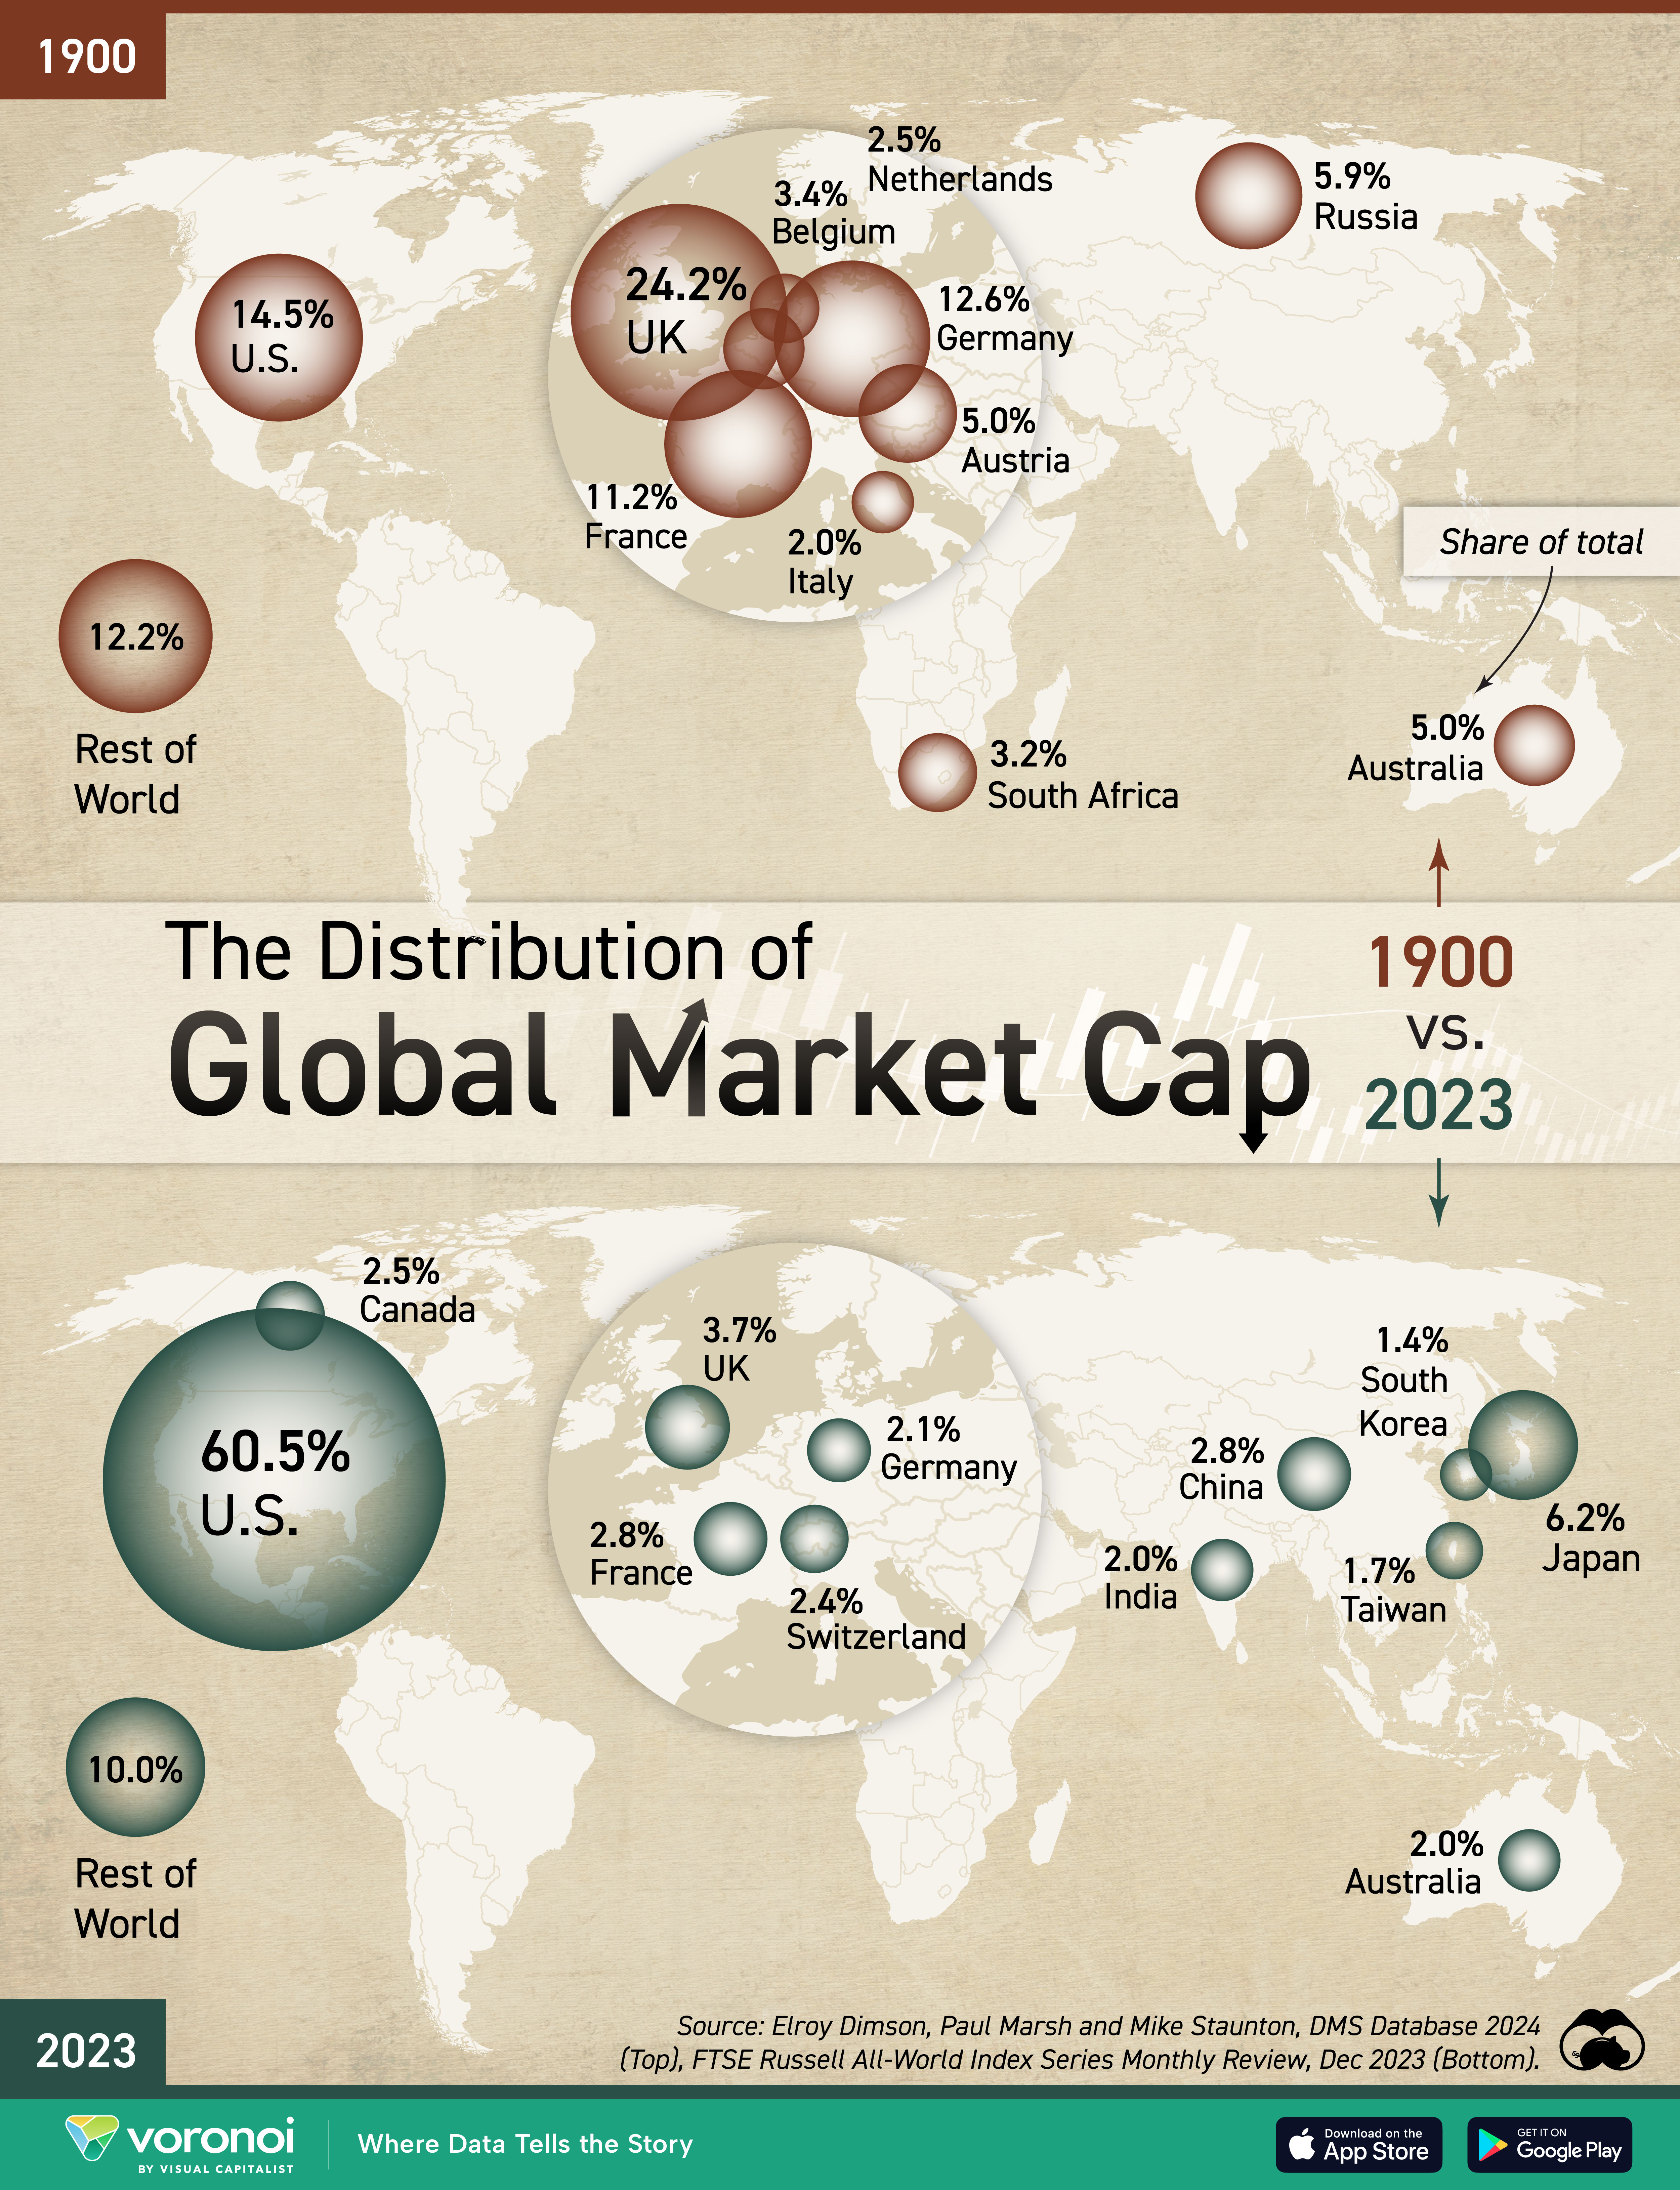
The World’s Largest Stock Markets📈 📊
Check out this infographic comparing the world's largest stock markets in 1900 and 2023 based on their global market capitalization share. 📈
Key Takeaways:
🔹 1900 Snapshot:
🇬🇧 UK: 24.2%
🇺🇸 U.S.: 14.5%
🇩🇪 Germany: 12.6%
🇫🇷 France: 11.2%
🇷🇺 Russia: 5.9%
🇦🇹 Austria: 5.0%
🇧🇪 Belgium: 3.4%
🇦🇺 Australia: 3.4%
🇿🇦 South Africa: 3.2%
🇳🇱 Netherlands: 2.5%
🇮🇹 Italy: 2.0%
🌍 Rest of World: 12.2%
By 1900, the UK dominated with nearly a quarter of the global market cap. European countries collectively held over 67% of the market.
🔹 2023 Snapshot:
🇺🇸 U.S.: 60.5%
🇯🇵 Japan: 6.2%
🇬🇧 UK: 3.7%
🇨🇳 China: 2.8%
🇫🇷 France: 2.8%
🇨🇦 Canada: 2.5%
🇨🇭 Switzerland: 2.4%
🇩🇪 Germany: 2.1%
🇦🇺 Australia: 2.0%
🇮🇳 India: 2.0%
🇹🇼 Taiwan: 1.7%
🇰🇷 South Korea: 1.4%
🌍 Rest of World: 10.0%
In 2023, the U.S. stands as the world’s largest stock market, with a substantial share of 60.5%. The emergence of Asian markets like Japan, China, and India highlights a significant shift. China and India are projected to be the world’s top economies by 2075, potentially expanding their stock markets even further.
#stockmarket #globalmarkets #financialhistory #investment #markettrends #economy #finance #business #datavisualization #stockmarketanalysis

