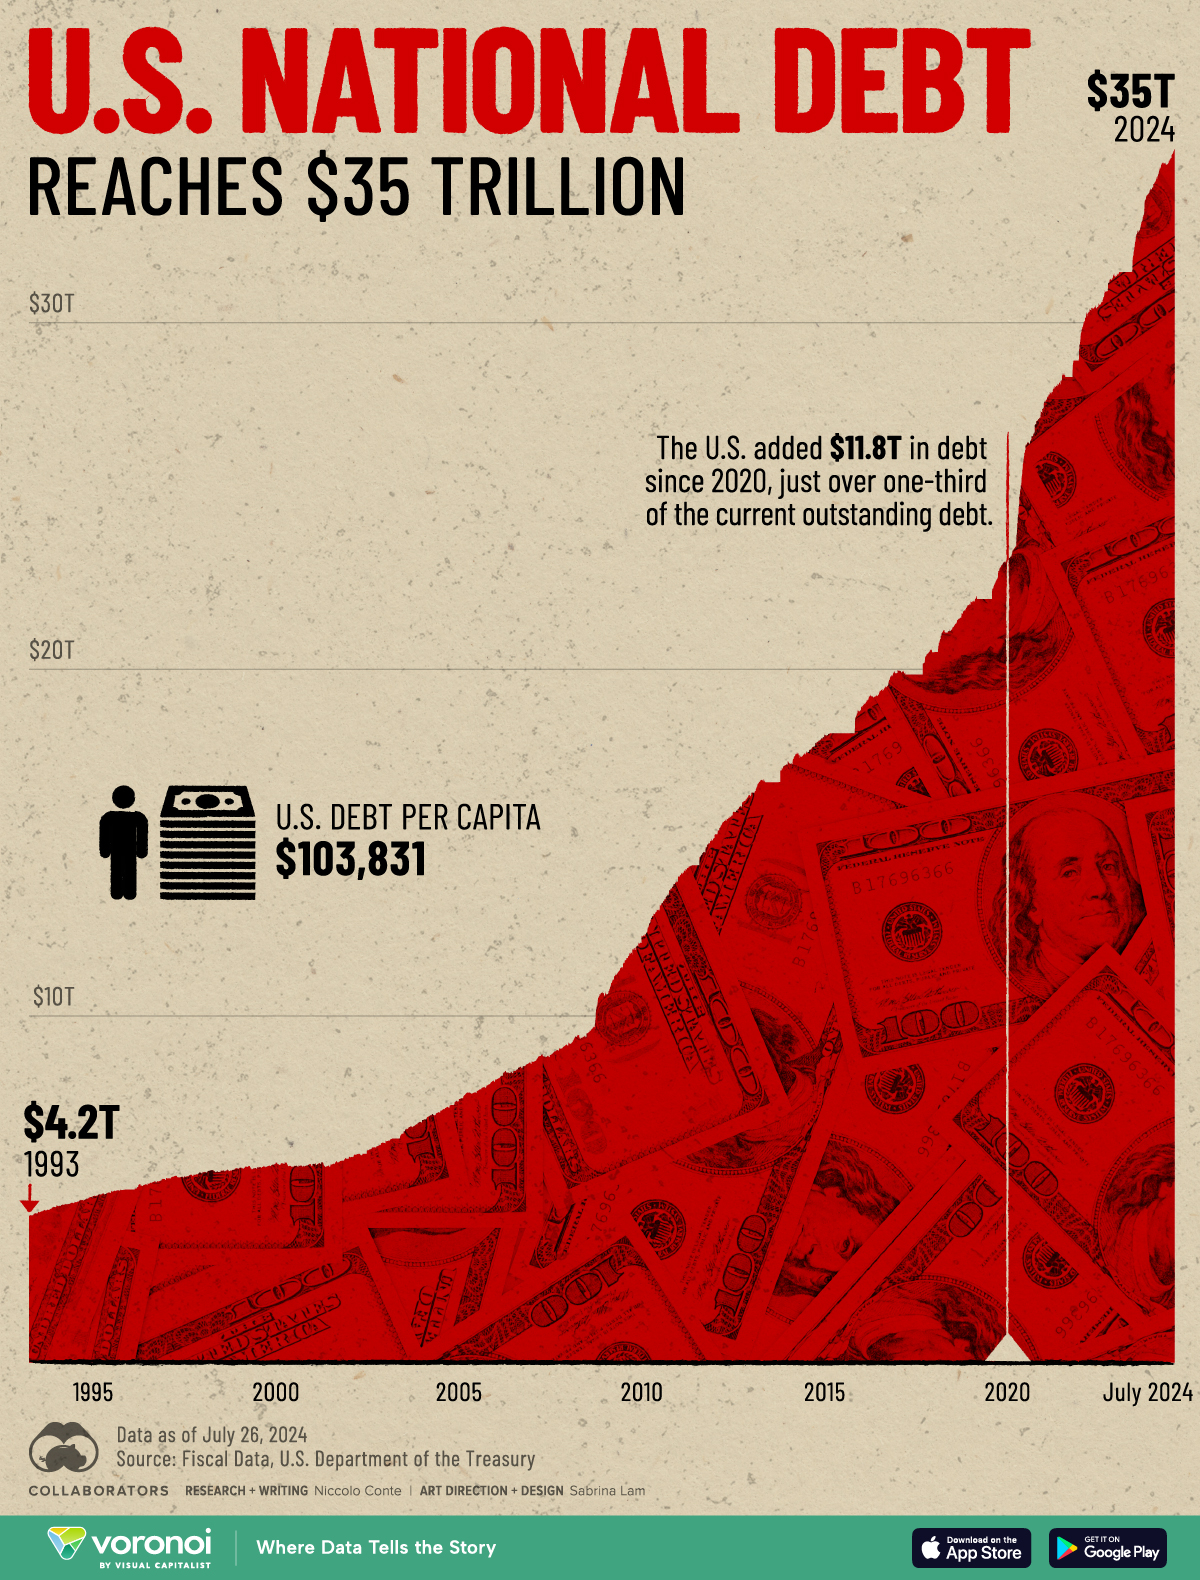
📊 The U.S. National Debt Reaches $35 Trillion
The U.S. national debt has soared to a new milestone of $35 trillion, just halfway into 2024. This rapid increase, adding $1 trillion since January alone, has pushed the debt-to-GDP ratio to 98%. The International Monetary Fund projects that this ratio could exceed 140% by 2032 under current policies.
Despite the looming threat to U.S. fiscal sustainability, both Republican and Democratic parties show little political incentive to address the rapid pace of borrowing. This graphic, based on figures from the U.S. Department of the Treasury’s Fiscal Data website, highlights the ballooning national debt.
A New Milestone is Reached
Today, the U.S. national debt equals the combined GDP of China, Japan, Germany, India, and the United Kingdom.
Since 2020, the U.S. has added $11.8 trillion to its national debt, making up more than one-third of the current total. For perspective:
2024 YTD: $35.0T
2024: $34.0T
2023: $31.4T
2022: $29.6T
2021: $27.7T
2020: $23.2T
2019: $22.0T
2018: $20.5T
2017: $20.0T
2016: $18.9T
2015: $18.1T
2014: $17.2T
2013: $16.4T
2012: $15.2T
2011: $14.0T
2010: $12.3T
2009: $10.7T
2008: $9.2T
2007: $8.7T
2006: $8.2T
2005: $7.6T
2004: $7.0T
2003: $6.4T
2002: $5.9T
2001: $5.7T
2000: $5.8T
1999: $5.6T
1998: $5.5T
1997: $5.3T
1996: $5.0T
1995: $4.8T
1994: $4.5T
1993: $4.2T
Rising Interest Costs:
In 2024, interest costs on the national debt are forecast to reach 17% of federal spending, making it the fastest-growing expense. These costs are expected to increase further as higher interest rates drive up the cost of new borrowing.
Image: Visual Capitalist
#usdebt #nationaldebt #fiscalpolicy #economictrends #governmentspending #debtcrisis #economicoutlook #financialdata
